Dashboard
The dashboard is a central access point to reach a number of tools that are automatically run when the platform is installed. There are two types of tools: components and monitoring.
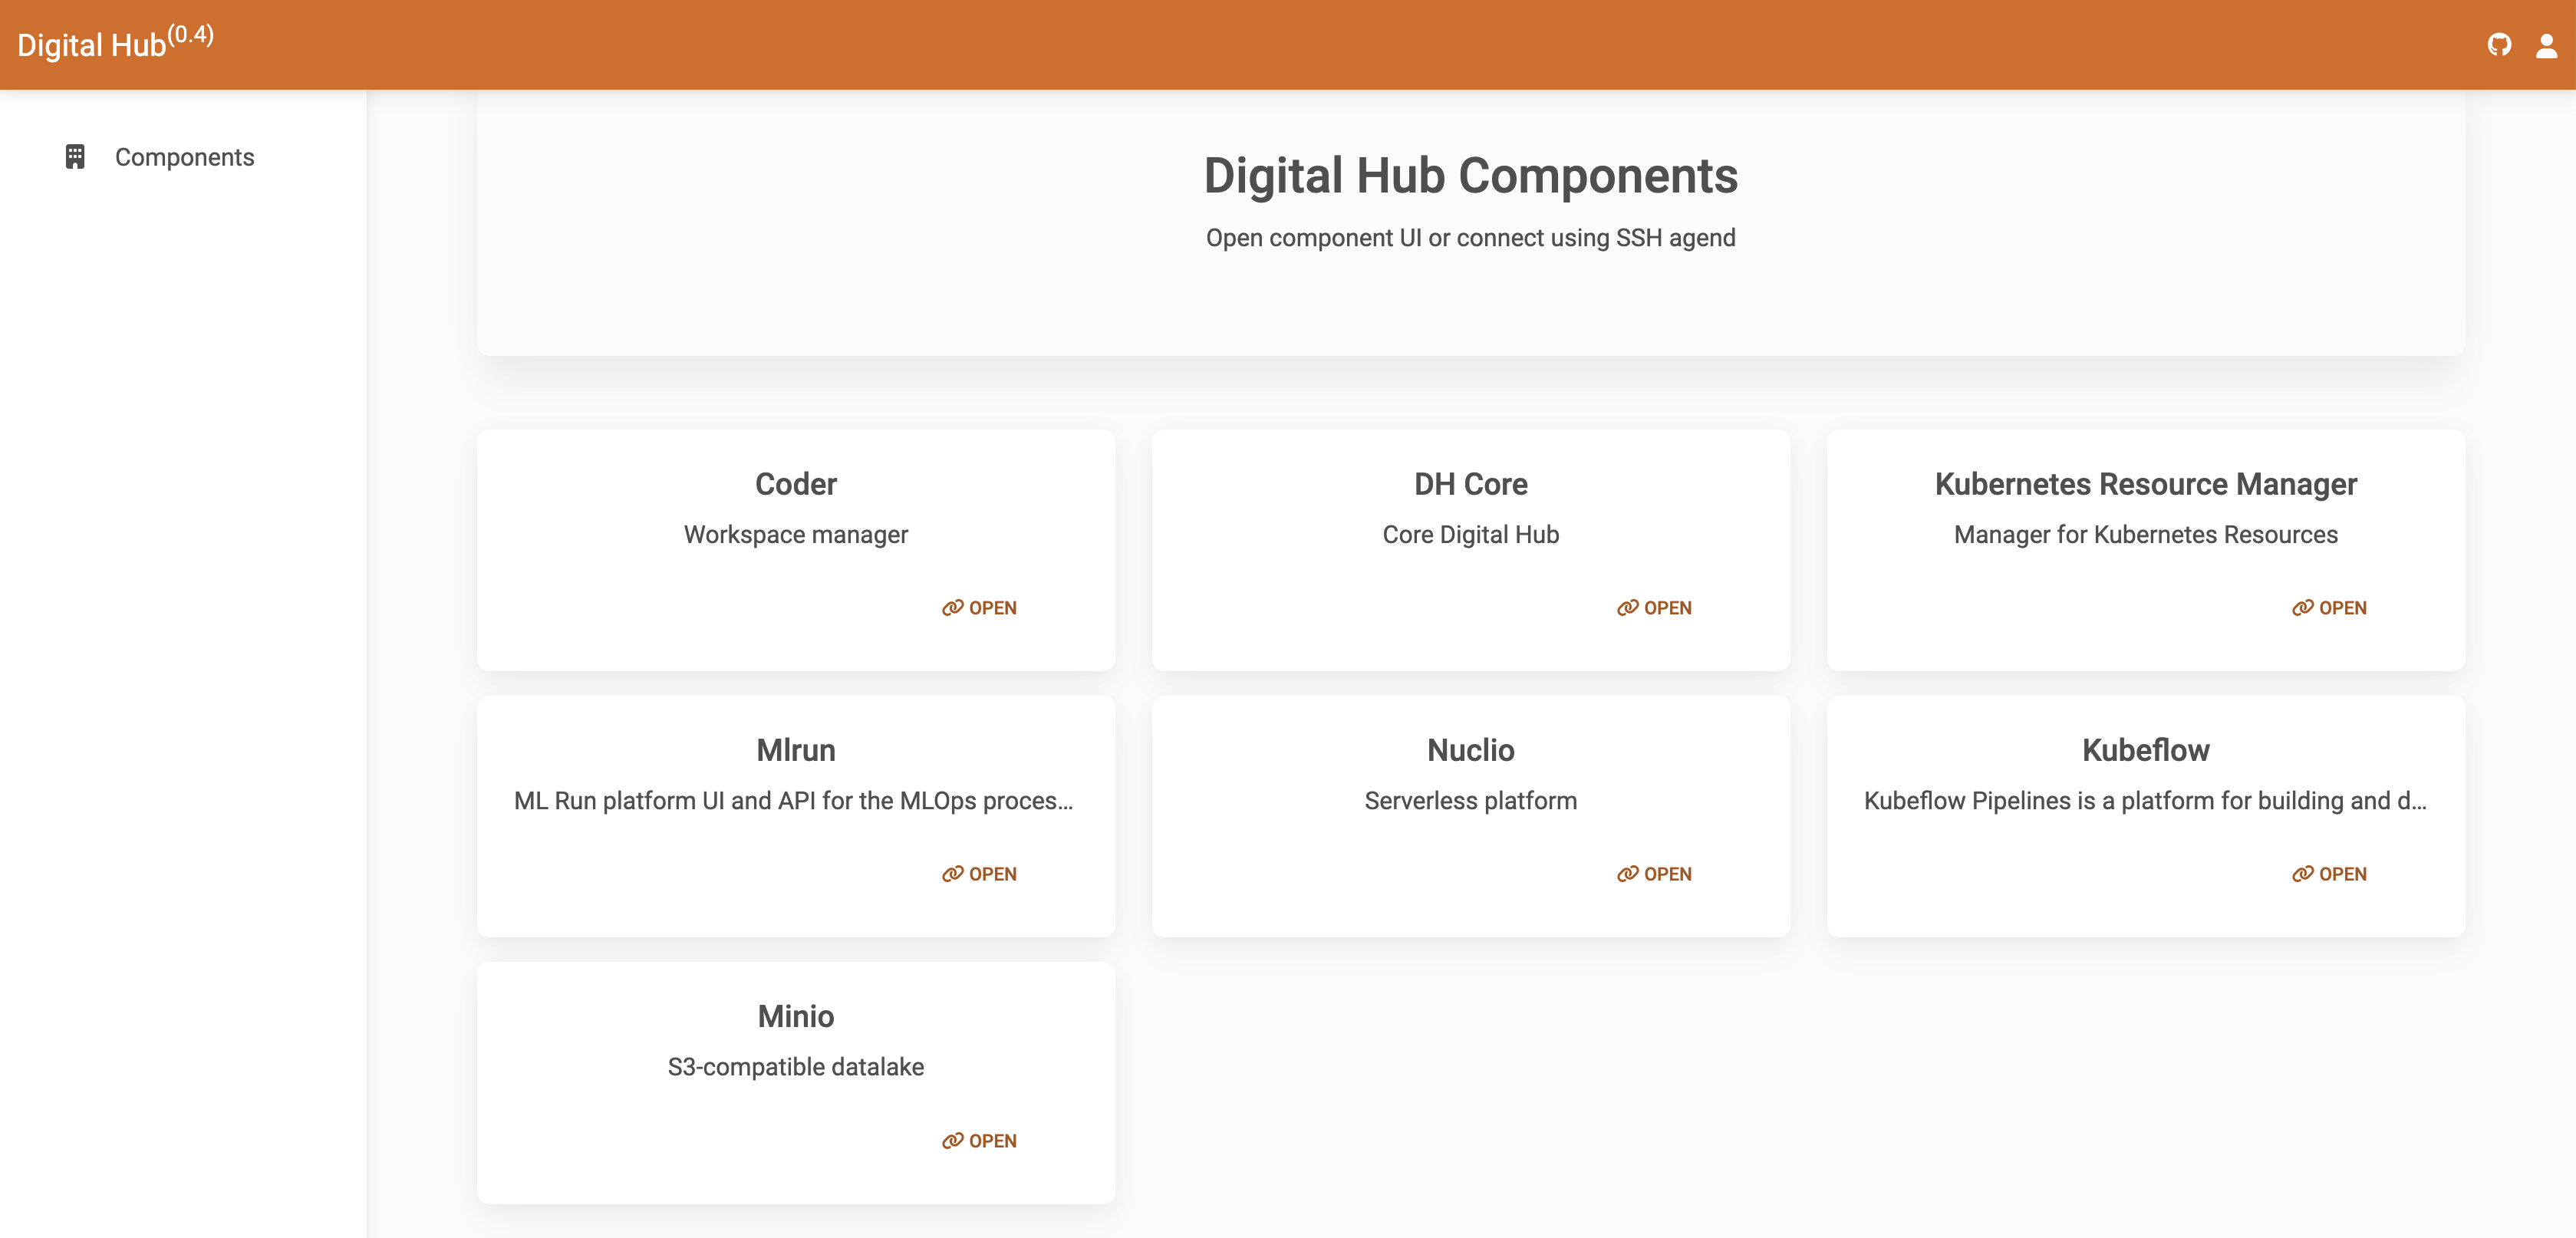
Components
- MLRun, a framework for MLOps
- MinIO, an S3-compatible object datalake
- Nuclio, a platform for serverless functions
- Kubeflow, a tool for ML workflows on Kubernetes
Monitoring
TODO - Monitoring features are work-in-progress.
- K8S Infrastructure: deployed components and services
- Resources: CPU, traffic, memory usage...
- Application logs: Log data of components and services
How to access
Access your instance of Coder and, under the Workspaces tab, you should see digitalhub-dashboard already listed. Click on it and you will see its logs and, above them, a number of buttons. Click on dashboard.
If digital-dashboard isn't already there, you can create it by navigating to Templates and clicking Use template to the right of the dashboard entry.